This modules measures your shop floor working capacity against your order book. It can also incorporate live quotes. There are various setup procedures that need to be done in order for it to do this.
Open up the work centres module. The first thing you will need to decide are which work centres you want show in the capacity planning module. This is decided by the 'Capacity Plan' check box as shown below.
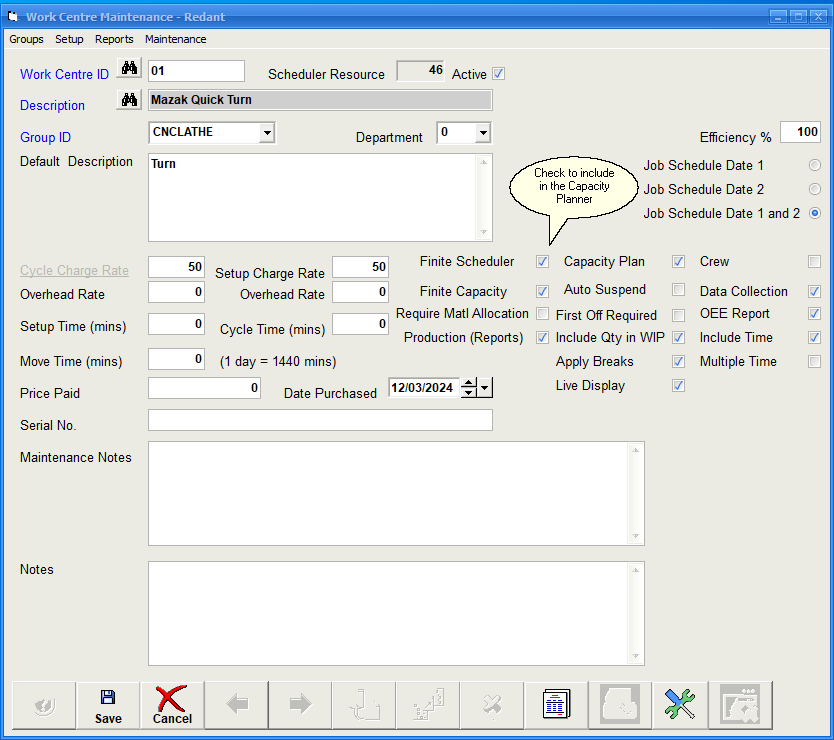
We are only concerned with work centres that are internal to the company so anything external e.g. subcontract work can be unchecked as we do not want to measure capacity of external resources.
Work Centre Groups play an important role in both the Capacity Planner and Finite Scheduler modules. This enables us to group similar work centres together so we can see the overall capacity for that group e.g. we could group all the milling machines together in a group and the same could be done for the turning centres as well.
Select groups from the top menu will display a grid with all the current Groups listed. You can add new groups by entering a new group ID and a description on a new line at the bottom of the grid. Keep the group ID small, preferably without spaces as you can use the description column for a more detailed explanation.
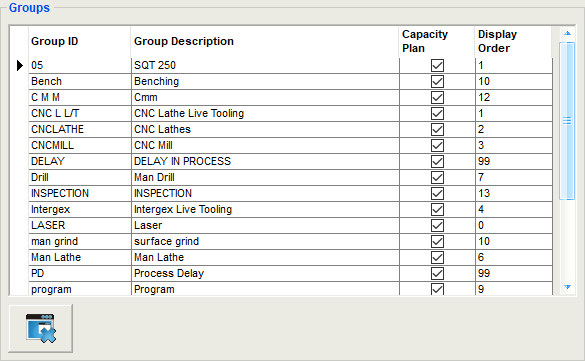
Check the Capacity Plan column to include the group in the capacity planning module. Again as per the work centre itself, remove this for a subcontract group as we do not want these in the capacity planner.
The 'Display Order' defines in which order the group will be visible in the capacity planning module. Number each group start with 1. You can leave gaps between the numbers if you wish as the order is determined by lowest to highest number.
From the top menu select the following:
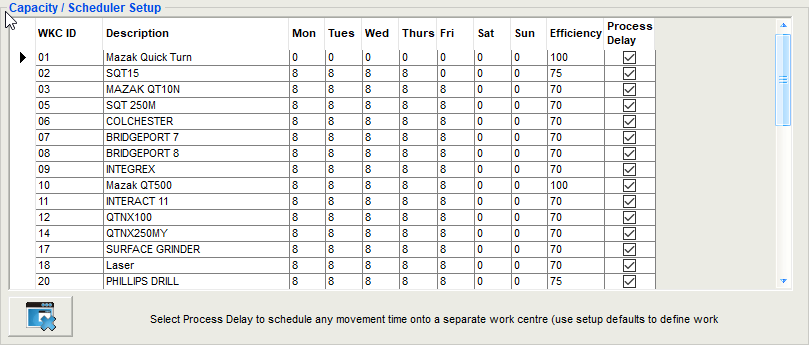
Here we define the working hours per day for each work centre as per the example above. We would suggest leaving Saturday and Sunday at 0 unless a specific work centre is always run on any of these days. Entering any hours for any work centre, the system will assume that those hours are available for each and every day.
The efficiency defines how many hours the work centre can actually do as apposed to what you would like it to achieve. Very rarely is a work centre 100% efficient within a working day due to delays in job changeovers etc. We would suggest entering a value of 75% per work centre as a starting point. This value can be changed at any time once we can get some feedback from collecting time from the shop floor.
For subcontract work centres then set the hours per day to 24 for Monday to Friday. Leave the weekend as 0. Set the efficiency as 100% for these work centres.
You can ignore process delay as this is a feature of the finite scheduler.
Now we have setup the basics we can have a look at the Capacity Planning Module. From the Main Menu select Capacity Planning
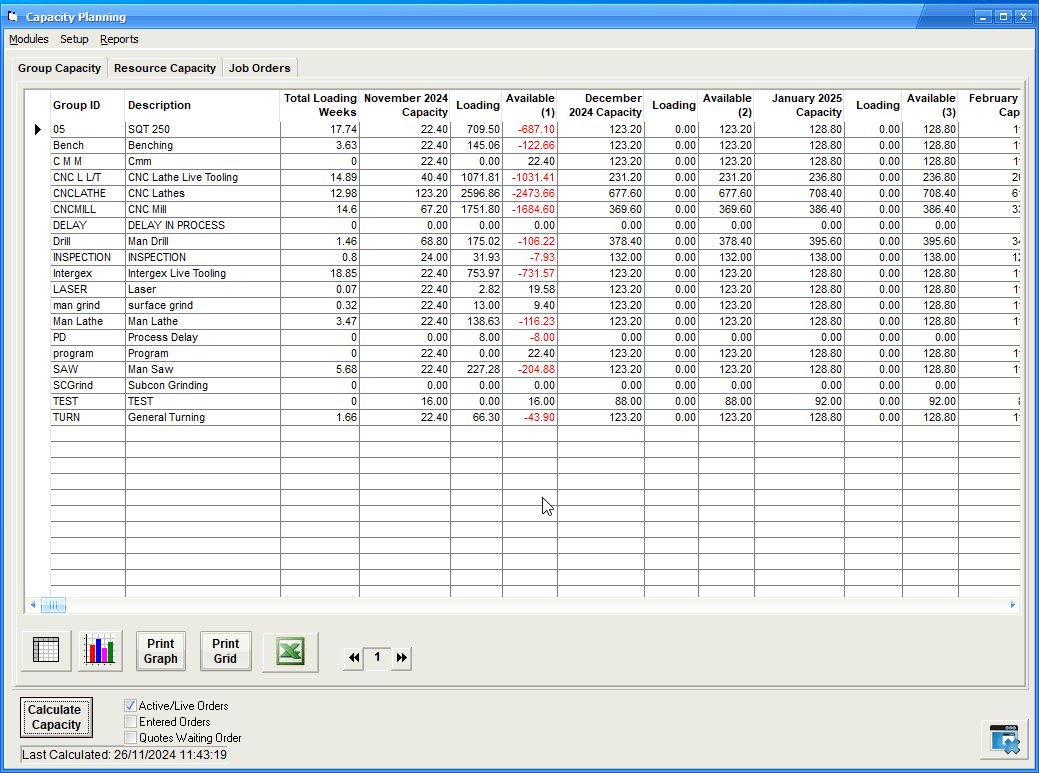
The screen above shows our work centre Groups listed in the order we defined earlier.
On the bottom left of the screen you will see the Date and Time the capacity plan was last calculated. To get an updated view select the 'Calculate Capacity' button. Answer 'Yes' to 'Calculate Resource/Group Capacity'. The system will now calculate your capacity per work centre/group and show this against your actual work load required.
Accurate estimated planning times for each operation for each live job is essential to these calculations as well as the customers delivery date required. If times are omitted from operations or operations are not included for any one job then these times will not be reflected in the calculations and will give incorrect loadings.
The shop floor data collection module is a necessary requirement to give accurate and up to date data when using either the capacity planning and finite scheduling modules. Data collected from the shop floor is used to reduce overall job operation times. New active jobs are also being added to the loadings.
The initial tab displayed is for the Group Capacity. This shows each group with a Total Loading in weeks and then Capacity,Loading and Available columns for the next 12 months. The current month's capacity will change every time the 'Calculate Capacity' takes place as capacity (days remaining in the month) reduces.
The 'Available' column will show as a red negative figure if the work load within the month is greater than available capacity, highlighting where you have too much load on a specific group. Any negative 'Available' values are not carried forward to the next month. For example in the screen shot above, the 05 group has a capacity remaining in November of 22.4 hours and a requirement of 709.50 hours leaving a shortfall of 687.10 hours. Next months available capacity is 123.2 hours, no loading and available of 123.2 hrs. It will take several months to reduce the 709.5 hours shortfall in November to get this work through the shop.
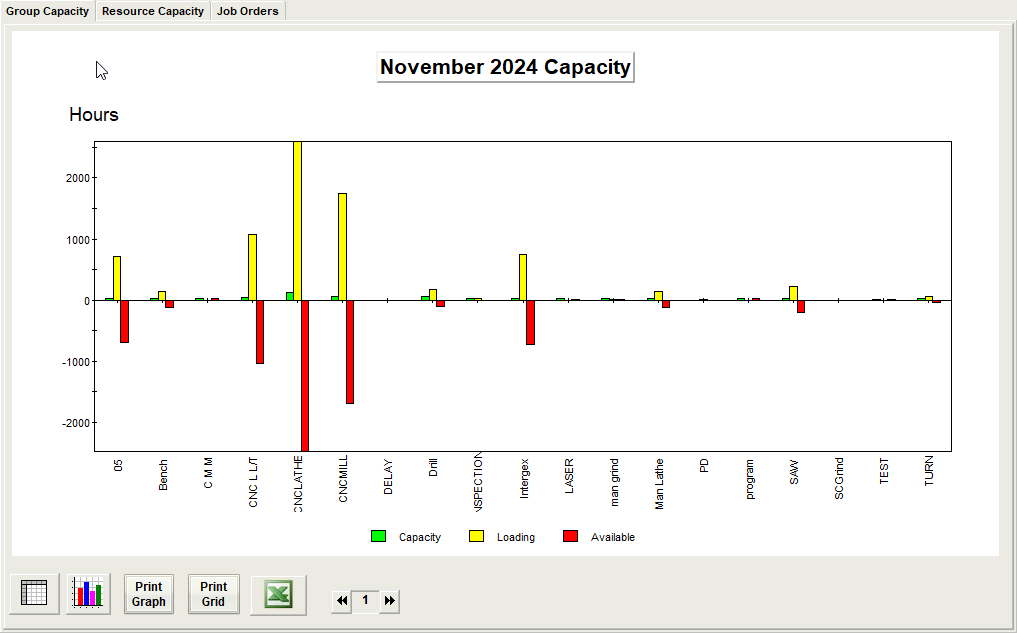
Selecting the graph button ![]() will display a graphical representation of a specific month. Use the
will display a graphical representation of a specific month. Use the ![]() buttons to change months.
buttons to change months.
Any groups with an available capacity in red reflect areas where there is insufficient hours within the month to process the job operations required.
Selecting the 'Resource Capacity' tab will show all the work centres that were selected in the work centre module as shown earlier in this topic.
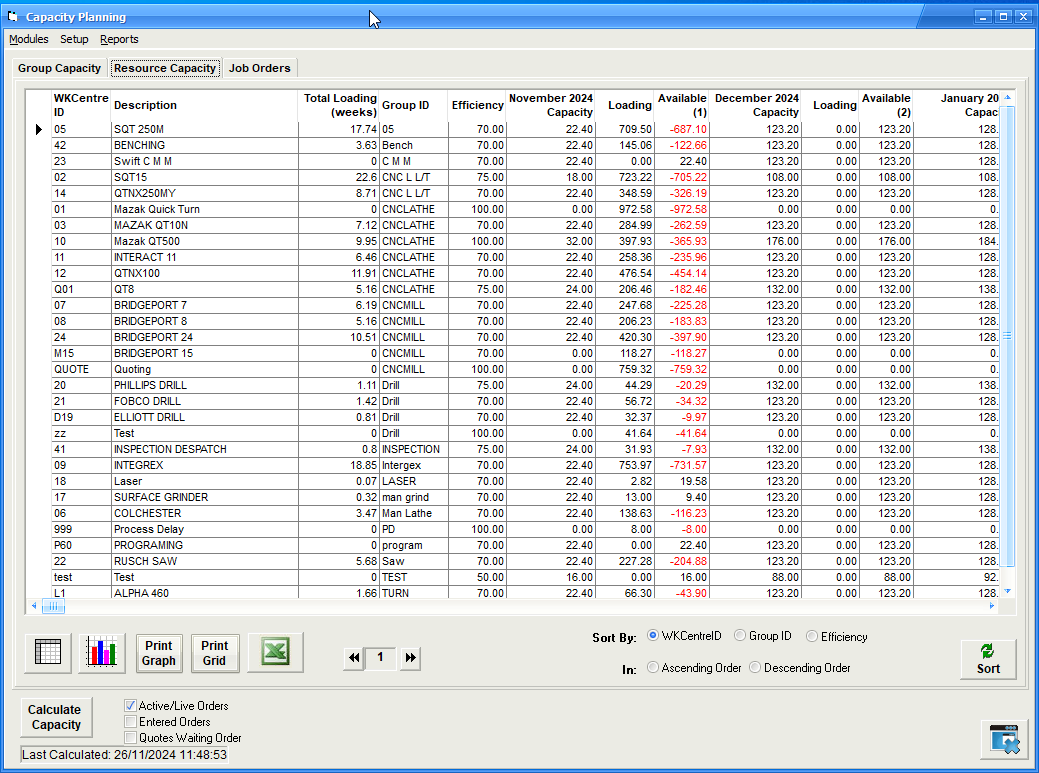
If you are only using the Capacity Planning' module then some work centres may show negative loadings and some with available capacity which belong to the same group. This is due to the capacity planning modules inability to proportion the work load over the group. In this instance the Group tab will give a better visibility of loadings. If however you are also using the Finite Scheduler then as schedules are released for production, this will reflect an even distribution of work across the group and a more accurate state if viewing by resource.
The 'Job Orders' tab will list all job operations as seen below
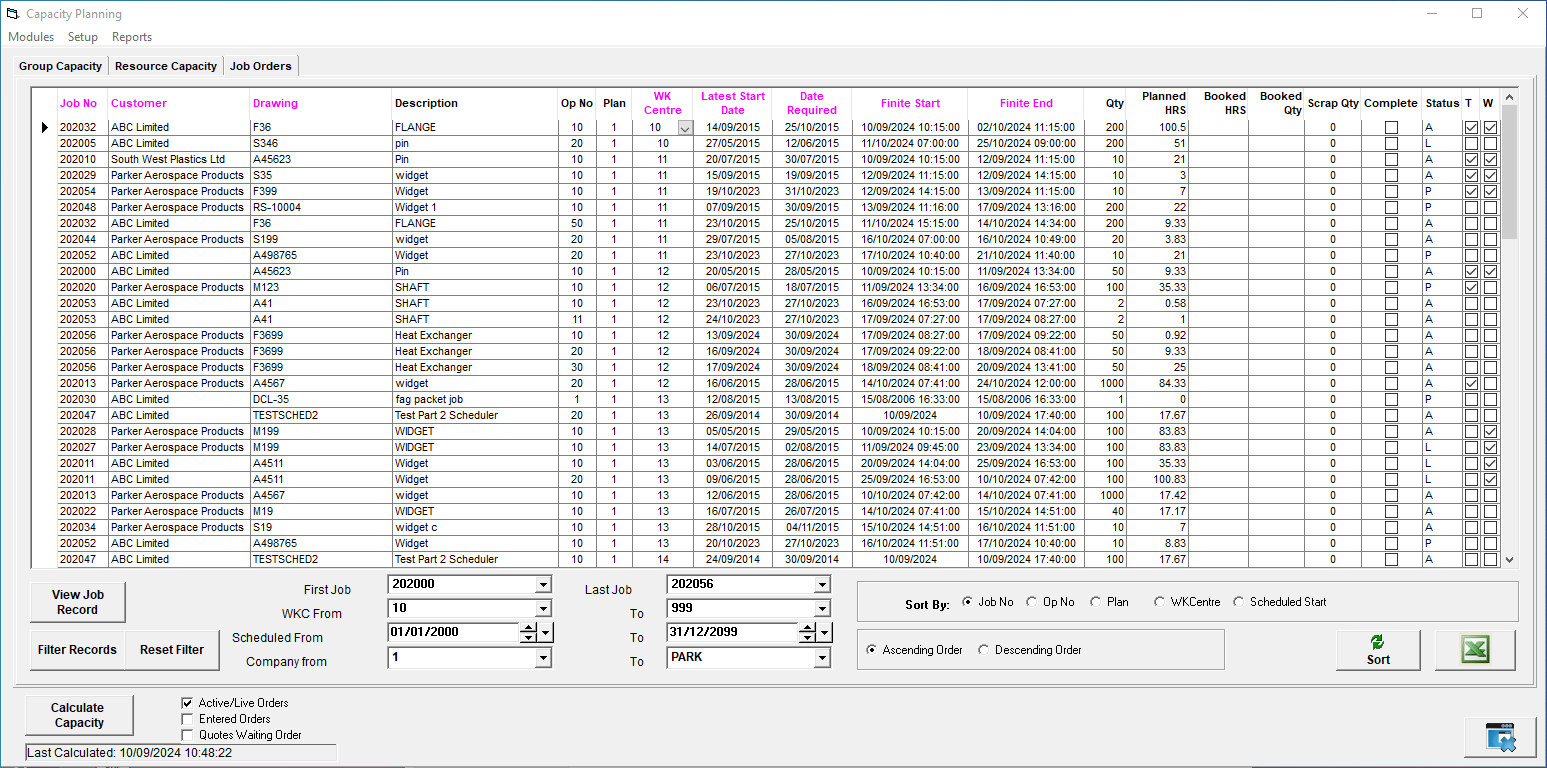
The 'magenta' coloured headings allow the user to order the column by clicking the heading itself. This will reorder the data in the column by the heading name.
The 'Latest Start Date' has been calculated to show the latest possible date the operation can be started to fulfill the customers delivery date. This date does not take in to account any other job/operation needing that resource at the same time. This is where the capacity planning modules differs from the finite scheduling module. The finite schedule module schedules job operations on available work centres one after the other depending on certain scheduling algorithms until the work centres run out of work. This gives a very accurate delivery date for the completion of any one job. However the capacity planning modules will show you how much capacity you need in any one given month to enable you to deliver all your customer order on time.
The Finite Start and End columns are derived from the finite scheduler and show the exact start and end times the operations are scheduled to be done.
A the bottom of the window are a series of options to enable the user to filter the records in the grid. Change any of the data followed by the 'Filter records' button to show the results in the grid. The 'Reset Filter' will restore all values back to their defaults followed by selecting the filter records again.